
Metabase
Screenshots
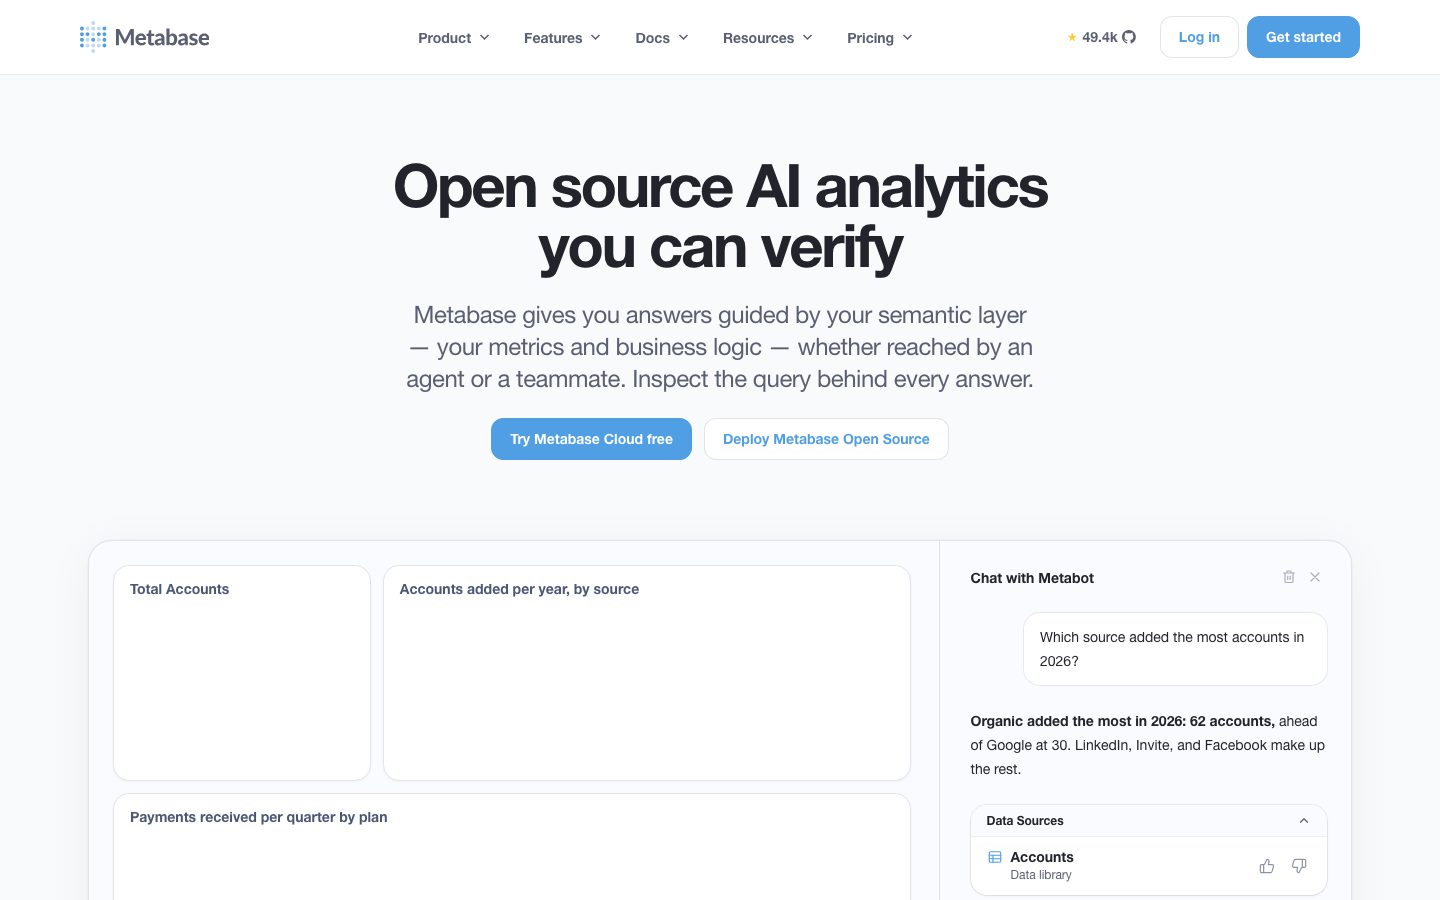 1 / 2
1 / 2The Story
Metabase is a business intelligence tool aimed at the people who have questions rather than the people who write SQL. It connects to a database, reads the schema, and presents a point-and-click query builder alongside a native SQL editor for users who want one.
The product's distinguishing choice is that it does not require a modelled semantic layer before it is useful. Connect a database and the tables are immediately explorable, with questions saved as reusable cards and assembled into dashboards. Alerts and subscriptions push a saved question to email or Slack on a schedule.
Metabase is open source with a paid enterprise edition that adds features such as granular permissions, sandboxing, and audit logging. It is a good fit for a team that needs self-service reporting over an existing database; it is a weaker fit for heavy financial modelling or for organisations that need a governed semantic layer with versioned metric definitions.
Overview
Metabase assumes the data already lives in a database and that the fastest path to an answer is to make that database explorable.
Connect a database and Metabase reads its schema. Tables and columns become browsable, and the query builder lets a user filter, aggregate, and join without writing SQL. Each saved query becomes a card that can be placed on a dashboard, and dashboards can be shared with people who have no interest in how the query was built.
A native SQL editor sits alongside the visual builder for questions the builder cannot express. Saved SQL questions behave like any other card, so an analyst's work and a business user's work end up in the same dashboards and the same subscription schedules.
The open-source core is the reason many teams start here: there is no modelling project to complete before the first useful chart. The paid edition adds governance features such as granular permissions and audit logging, which is where an organisation with stricter access requirements tends to land.
Key Features
- Visual query builder
Filters, aggregations, and joins are assembled without SQL, so a business user can answer a question directly.
- Native SQL editor
Analysts can write SQL, and the results become cards that sit in the same dashboards as visual questions.
- Dashboards and subscriptions
Saved questions compose into dashboards, and scheduled alerts deliver results to email or Slack.
- Open-source core
The core product is open source and self-hostable, with a paid edition that adds governance features.
Where Metabase is a strong choice, and where it is not
Choose Metabase when the data already lives in a database and the goal is to let non-analysts answer their own questions without waiting on a modelling project.
Look elsewhere if the organisation needs a governed semantic layer with versioned metric definitions, or heavy financial modelling with writeback. Metabase reads and reports; it is not a planning tool.
Getting started
Connecting a database is quick; the first useful dashboard depends on how well the schema is understood.
- ~10 minTime to first chart
Connect a database, pick a table, and the query builder produces a chart without SQL.
- FreeCost to start
The open-source edition is free to self-host. Paid cloud and enterprise plans add governance.
- A databasePrerequisites
An existing database with data in it, plus somewhere to run the application.
Known limitations
Constraints confirmed from the project's documentation.
- No semantic layer out of the box. Metric definitions live in individual questions, so the same number can be calculated two ways in two places.
- Self-hosting is your responsibility. The application and its database are yours to back up and upgrade.
- Reporting only. It reads and displays; it does not write back or support planning workflows.
- Performance follows the source database. A slow query in Metabase is still a slow query.
Pick Metabase when non-analysts need to answer their own questions
It is the shortest path from an existing database to a dashboard a business user can build without waiting on the data team.
The product's bet is that a modelling project should not be a prerequisite for the first useful chart. Connecting a database and exploring it is genuinely fast.
If the organisation needs governed, versioned metric definitions, a semantic-layer product is the right category and Metabase will feel too loose.
FAQ
What is Metabase?
Metabase is a business intelligence tool that connects to a database and lets users build queries and dashboards with or without SQL.
Is Metabase free?
The open-source edition is free to self-host. Paid cloud and enterprise plans add governance features such as granular permissions.
Do I need to write SQL to use Metabase?
No. The visual query builder covers filters, aggregations, and joins, and a native SQL editor is available for questions it cannot express.
Can Metabase send scheduled reports?
Yes. Saved questions and dashboards can be delivered to email or Slack on a schedule.
What stack is Metabase built with?
CompassPad records Metabase as a Clojure backend with a React and TypeScript frontend, based on its public repository.
What we checked
- LIVESite and primary link
The marketing site resolved and the primary product link reached the application.
- PRICINGPricing page
The pricing page resolved and lists a free open-source edition alongside paid cloud and enterprise plans.
- DOCSDocumentation
Documentation is public and covers the query builder, SQL editor, and dashboards.
- FRESHNESSChangelog
Dated releases are published on a public page and are reachable without an account.
Discussion
No comments yet. Be the first.
Join the conversation. Sign up to comment.
Sign up free